Exective summary
Introduction
To an outside observer, Grand County's economy is thriving. Transient Room Tax ("TRT") revenues are up 41% over 2019 ($188.3M in 2025 vs. $133.5M in 2019)2. Hotel demand, as measured by room nights, is up 22.6%3. Visitation to the area rose sharply during the post-COVID boom and Moab continues to be viewed as a destination people want to visit.
However, this narrative doesn't match what many businesses are feeling on the ground, and the numbers tell a more complicated story.
While both nominal and real TRT revenue are up over 2019, real TRT has been declining since COVID, from a peak of $196.9M in 2021 to $149.8M in 20252. Revenue Per Available Room ("RevPAR") is down almost 10% in real terms vs. 20193. Occupancy rates in 2023 and 2025 were the lowest in a decade outside of 2020.3 All of these changes have occurred during a period in which visitation to Arches National Park has fallen below 2019 levels, and lower relative to other parks in the region and nationally.
How do we square the conflicting signals in the local economy?
A common explanation points to the introduction of the Reservation System at Arches National Park in April 2022. The Timed-Entry policy became the default explanation for the changes in unit economics felt by Moab businesses.
Two different local reports have questioned this. In 2024, the National Park Service published a report evaluating the economic impacts of the Reservation System on the local economy and found no real effect on visitation or visitor spending owing to the policy. Later that year, Grand County resident Matt Hancock presented a white paper to the County Commission finding a different conclusion: that the introduction of Timed-Entry resulted in a $45M gap in potential economic activity in the area6
As presented in this paper, the data of both studies is accurate within their respective scopes, but both fail to capture the larger economic picture. The NPS study did not account for how the macro-conditions played out within individual businesses, and did not examine how Timed-Entry may have had a variable impact on unit economics, even if it didn't compress the economy nominally. Hancock's white paper correctly identified that inflation-adjusted lodging revenue ran below prior trends during the Timed-Entry period, but he did not consider whether other variables better explained the change. His choice to select 2021 as the comparative baseline also overstated any effects, instead of comparing the Timed-Entry period to the years before the COVID shock.
This report examines the full economic picture prior to and throughout the years following COVID in order to disentangle overlapping causes and identify factors the prior analyses did not consider.
Examining the whole story
Based on pre-COVID trends, Arches National Park had about 300,000 fewer visitors than projected between 2022 and 2025. At NPS spending rates, those missing visitors represent up to $48 million per year in potential Arches-related spending, though this is a modeled gap, not a direct measure of lost county revenue. The data cannot tell how many of those visitors still came to Grand County and spent money without entering Arches. Hotel demand and restaurant spending remained above 2019 levels throughout the period, even as park visits fell. Depending on the baseline used, the regression associates $6-11 million per year of the modeled Arches-related spending gap with the Timed-Entry variable5. The rest requires a different explanation.
Regardless of the cause, the economic pressure experienced by businesses across the tourism sector is verifiable.
TRT revenue and Arches visitation were already bending away from their growth curves prior to COVID but at different rates. Arches visitation stagnated in this period, while TRT revenue in both real and nominal terms continued to grow, albeit at a slower rate. Between 2016 and 2019, Arches visitation grew just 1.5% per year1. Over the same period, nominal TRT grew 8.2% annually2, real restaurant taxable sales grew 4.5%2, and hotel demand grew 4.9%3. Lodging tax revenue per Arches visitor rose 21%, from $66 to $807.
This pattern continued through the Timed-Entry period: hotel demand sat above 2019 levels in every year, and shoulder-month visitation increased considerably.
The economy was outgrowing Arches before COVID
Key indicators indexed to 2016 = 100
All series indexed to 2016 = 100. Lodging and food series use Tax Commission quarterly sector data for 2010-2014, then monthly TRT and restaurant panel data from 2015. Hotel demand (CoStar) available from 2013. COVID period (2020-2021) shown dashed. Sources: NPS IRMA; Utah State Tax Commission (quarterly sector data, monthly TRT/restaurant); STR Inc./CoStar.
| Indicator | 2010 | 2011 | 2012 | 2013 | 2014 | 2015 | 2016 | 2017 | 2018 | 2019 | 2020 | 2021 | 2022 | 2023 | 2024 | 2025 |
|---|---|---|---|---|---|---|---|---|---|---|---|---|---|---|---|---|
| Arches visits | 64 | 66 | 68 | 68 | 81 | 88 | 100 | 97 | 105 | 105 | 78 | 114 | 92 | 93 | 92 | 95 |
| Real lodging | 53 | 56 | 64 | 66 | 80 | 90 | 100 | 109 | 114 | 116 | 90 | 170 | 149 | 138 | 136 | 129 |
| Hotel demand | — | — | — | 83 | 90 | 96 | 100 | 106 | 110 | 115 | 95 | 136 | 132 | 132 | 136 | 141 |
| Real food | 62 | 68 | 70 | 74 | 82 | 93 | 100 | 104 | 110 | 114 | 92 | 141 | 131 | 127 | 129 | 119 |
All indexed to 2016 = 100. Real values deflated using CPI-U West (Dec 2019=1.0). Lodging and food 2010-2014 from Tax Commission quarterly sector data (NAICS 721, 722); 2015+ from monthly TRT and restaurant panels. Hotel demand = room-nights sold (CoStar/STR Inc., from 2013). COVID years greyed. From 2016 to 2025: Arches visits fell 5% while real lodging grew 29%, hotel demand 41%, and real food 19%.
Two shifts shaped the post-2021 economy
Demand normalized before timed entry while Arches visits stayed down. All series indexed to 2019 = 100
All series indexed to 2019 = 100. Arches visits: NPS IRMA Portal. Real TRT: Utah State Tax Commission, deflated by CPI-U West (Dec 2019 = 1.0). Hotel demand (room-nights sold): STR Inc./CoStar via Moab Area Travel Council. COVID years (2020-2021) shown in grey. TRT peaked in mid-2021 and had already declined 9% before Timed-Entry launched in April 2022.
Arches visitation did drop during Timed-Entry, and the regression finds a correlation between the permit system and $6-11 million per year of the modeled Arches-related spending gap, depending on the baseline5. But this correlation does not explain the overall drop, or the full economic pressure felt by local businesses.
The decline concentrated in July and August when permits were not selling out, while the months where permits actually constrained access had the most stable revenue of the Timed-Entry period. County lodging tax in those constrained months ran 112-126% of 2019 despite Arches visits running 14-18% below 2019 levels.
Supply-side changes explain more. Real revenue per available hotel room fell 23% from its 2021 peak3. Hotel demand grew 23% above 2019 levels, but 24% more hotel rooms3 and 42% more active short-term rental listings4 divided that demand across a larger competitive field. Occupancy held steady. Per-unit revenue did not. Real room rates fell below 2019 levels even as nominal prices rose, and when nominal rates began to drop, occupancy declined to its lowest level in a decade by 2025.
Individual operators captured a shrinking share of a growing pie. This pattern did not begin with Timed-Entry. Real ADR was declining before COVID, falling from $159 in 2017 to $153 in 2019. The 2021 surge temporarily reversed the trend, but by 2025 real ADR sat at $139, 9% below 20193. Real RevPAR fell 8.3% between 2017 and 20193 as hotel supply grew 14% against 9% demand growth3. The compression operators attribute to the permit system was already underway by 2017.
Section oneThe Pre-Timed-Entry Economy
Grand County's tourism economy changed substantially over the last fifteen years. Since the "Mighty Five" campaign launched in 2013, visitation to Arches National Park grew 40% through 2025, attracting more than 400,000 additional annual visitors1. Nominal Transient Room Tax revenue more than doubled over the same period, from $93.3M in 2015 to $188.3M in 20252. Even adjusted for inflation, 2025 TRT is $45M higher than 2015 in real terms.
But that growth was not continuous. Tourism expanded sharply from 2013 to 2017, decelerated through 2019, spiked during the post-COVID wave of 2021, and then contracted in real terms. The choice of benchmark period matters because the 2022-2025 interpretation changes depending on whether you compare to the boom years or the plateau years. This section traces the growth path that makes that distinction legible.
2013-2017: "The Mighty Five" Boom
From 2005 to 2013, annual visits to Arches National Park grew at a modest 4.2% compounding rate, rising from about 782,000 to 1.08 million 1. Then, in 2013, the Utah Office of Tourism launched the "Mighty Five" campaign, promoting Utah's five national parks as a collective destination. Visitation to the Park jumped 18.6% the following year1.
In 2014, Canyonlands National Park marked its 50th anniversary, followed by the National Park Service Centennial in 2016. These campaigns were hugely successful, and Arches visitation expanded another 23.4% between 2014 and 2016. Overall, between 2013 and 2017, Arches visitation grew from 1.1 million to 1.54 million visitors annually1.
This growth echoed locally in rising TRT revenues and the expansion of lodging and tourism-related businesses. The supply of hotel rooms increased about 18% to meet rising demand, occupancy jumped from 61.8% in 2013 to 66.5% in 2017, while RevPAR increased 44% nominally (+34% adjusted to 2019 dollars)3.
As the economy grew, so did congestion. Gate closures began over Memorial Day Weekend in 2015. By 2017, both growth and congestion had matured enough that the National Park Service was actively discussing a reservation system to manage capacity at Arches.
2017-2019: A receding wave
By 2017, the Mighty Five effect was fading across the cohort. All five Utah parks promoted under the campaign experienced a surge followed by a flattening: Canyonlands reached 105.8% of its eventual 2019 level by 2016, Zion hit 95.7%, and Capitol Reef and Bryce Canyon were on similar trajectories, each with its own timing and amplitude1. At Arches, visitation declined 3% in 2017, recovered 8% in 2018, and nearly flatlined by 2019. The deceleration was regional, not park-specific.
Utah's Mighty Five parks: boom and plateau, 2005-2019
Annual recreation visits indexed to each park's 2013 = 100
Annual recreation visits, indexed to each park's 2013 level = 100. All five parks show the post-Mighty Five surge (2014-2016) followed by a plateau or deceleration toward 2019. Source: NPS IRMA.
National coverage of overcrowding and park closures likely contributed to the softening. International media cited Moab as "a byword for congestion." But the exact mechanism is not directly observable in the data. What the data do show is the divergence that followed.
Despite the plateau in Arches visitation, the local economy continued to expand. Between 2017 and 2019, nominal TRT grew at a 6.3% compounding annual rate, real TRT at 3.2%2, and hotel demand at 4.4%3. Arches gate counts had already become an imperfect proxy for local economic performance before Timed-Entry existed.
The gap between visitation and revenue implies either higher per-visitor value, seasonal redistribution, or broader decoupling between park entry and local spend. Tax data cannot distinguish among those mechanisms. Part of the answer may be seasonal: shoulder-month visitation at Arches was already growing faster than peak season by 2018, spreading visitor activity across more of the year and into months when hotel availability was less constrained.
This matters for any comparison with the Timed-Entry era. Before 2017, Arches drove the local economy; as that marketing wave crested, its pull loosened. Fewer park visitors did not automatically translate into fewer tourism dollars.
Two counterfactual paths were possible from 2019 forward: visitation could have rebounded toward the pre-2017 growth curve, or it could have continued along the flatter 2017-2019 trajectory. COVID prevents adjudicating between them. That unresolvable question is why the later baseline dispute in this report's modeling section cannot be fully settled.
2021: Post-COVID Anomaly
In 2021, Arches visits hit 1.81 million, 8.9% above 2019 1. But the composition of that surge reveals something important: during the peak season of April through October, visits were only 2.8% above 2019 1. Due to congestion caused by the influx of visitors, the Park closed its gates 118 times across 116 days during 20218. Nearly the entire year's surplus was in the shoulder months, expanding the season beyond its normal range. The same pattern appeared at Canyonlands and Capitol Reef, though at different intensities, and continued into the years that followed.
Every day Arches closed its gates in 2021
Demand rose sharply, and supply expanded to meet it. Hotel room demand ran 17.5% above 2019 while supply had grown 12.1%3. Active short-term rental listings were also growing4, and vested projects in the pipeline prior to the 2019 lodging moratorium began coming online. When hotel rooms and active STR listings are counted together, total competitive lodging units grew roughly in line with demand by 2022 and pulled ahead by 2023. The 2021 surge temporarily masked a compression story that was already forming. Despite a 66.4% occupancy rate (3 points above 2019), the rate was nearly equivalent to 2017 (66.5%)3.10
Note: This report controls for the dip in visitation caused by COVID effects and the surge in visitation that followed. Other reports and dashboards evaluating the Grand County tourism economy post-COVID use 2021 as an economic baseline. 2021 is analytically unstable because it combines shoulder-month spillover, extraordinary congestion, and post-COVID release demand.
2022-2025: The Timed-Entry Years
Grand County's overall tourism economy stayed above 2019 even as the 2021 surge receded. During the four years of Timed-Entry (2022 through 2025), nominal TRT ranged from $188.3 million to $196.6 million, running between 41% and 47% above the 2019 baseline of $133.5 million2. The lowest of those four years, 2025, still represented $54.8 million more in annual tax collections than 2019.
Whether that counts as underperformance depends on which pre-COVID slope you extend. The full 2015-2019 trend projects $198M for 2025, 9.8% above actual revenues. But that trend includes the Mighty Five boom years of +11% and +9% growth, which had already faded by 2018. The flatter 2017-2019 trend (slope of $7.7 million per year, R² = 0.973) projects $180.3 million29. Actual 2025 nominal TRT of $188.3 million outperformed that projection by $8.0 million, or 4.4%.
The interpretive story depends on which baseline is chosen for comparison. If the post-"Mighty Five" boom is assumed to be the norm, and the plateauing from 2017-2019 the anomaly, then the economy underperformed over the last four years. If the pre-COVID plateau represented a correction, then the economy exceeded expectations. The modeling section that follows tests both.
Nominal TRT: actual vs. two trend projections
Nominal TRT in millions. The 2015-2019 trend (pink) includes the Mighty Five growth years and projects $198M for 2025. The 2017-2019 trend (magenta) reflects the post-boom deceleration and projects $180M. Actual 2025 TRT of $188M sits between the two. Source: Utah State Tax Commission.
When holding inflation constant, the story becomes more nuanced. Real lodging tax revenue peaked in July 2021 and began falling2. By the time Timed-Entry launched in April 2022, the 12-month rolling average of TRT revenue had already fallen about 9% from that peak. Nominal room rates increased dramatically post-COVID, reaching $186.80 in 2022 and $187.90 in 2023 before dropping back to $175.22 in 20253. But inflation cut into these gross gains every year, and real ADR declined, resting about 9% below 2019 by 2025.
Real lodging tax, 12-month rolling average 2015–2025
Monthly real TRT indexed to 2019 annual average = 100
Lodging tax: Utah State Tax Commission. Monthly real TRT indexed to 2019 annual average = 100 (avg. monthly real TRT = $11,196,547). 12-month centered rolling average valid Jun. 2015 through Jun. 2025.
The entire tourism sector experienced a contraction in real terms, but the change was not experienced the same way within each sector. Despite real accommodation taxable sales falling roughly 21% from their 2021 peak, real restaurant and food service spending fell only 4.4%2. Real restaurant spending has been strengthening since 2023 while real accommodation spending is down year over year over the same period. If visitors were being driven away entirely, these two trends would follow a similar pattern. Instead, they are diverging, suggesting that people continued to arrive and spend money, but the dominance of hotels has waned. If this holds, TRT lodging revenue is not the bellwether for the overall tourism economy it once was.
The decline was also not evenly distributed across the calendar. July and August, when the permit system was least constraining and permits frequently went unsold, accounted for the steepest drops in real TRT. The months when permits were closer to sell out (April, May, June, September, October) held comparatively steady.
Two potential Timed-Entry effects
If the reservation system had a negative effect on the local economy, this could have occurred through two forces:
- Operational constraints, which limited the number of permits available during periods of high demand, capping access beneath park capacity.
- Deterrence constraints, which drove people away who never attempted to obtain a permit in the first place even when they were available.
The seasonality in TRT and visitation trends becomes critical when evaluating whether the compression in TRT and other economic indicators can be associated with the Timed-Entry program. If drops in TRT or visitation occurred when permits were available, the system cannot be found to have a constraining operational effect
Some deterrence was noted by the General Manager of the Aarchway Inn, Venjamin Hopkins during the program's first year. "Timed entry initially brought cancellations and confusion in 2022, but its impact lessened as guests became familiar with the system." The hotel reportedly saw bookings rise week-over-week and year-over-year once guests were emailed about the change.
If curing the problem was as simple as sending an email, this effect would be expected to wane as the program became more familiar. A 2024 USU survey of Arches visitors found that 78% were aware of the permit system before arriving, 89% of those who tried to obtain a permit were successful, and only 5% decided to visit the day of arrival11. The pool of spontaneous visitors who would have been deterred by the system appears to be small.
Section twoEvaluating the Timed-Entry effect
This section asks a narrower question than public debate usually does: not whether Timed-Entry had any effect, but whether the timing, seasonality, and magnitude of the observed economic changes are most consistent with the permit system as the primary driver. The analysis can estimate how Timed-Entry aligns with changes in Arches visitation and with a modeled spending gap. It cannot directly observe how many denied or deterred park visitors still spent money elsewhere in Grand County.
A note on terminology
Throughout this report, months are classified by permit utilization: the share of days when 95% or more of available permits were claimed. Months where this threshold was exceeded on more than half of days are referred to as constrained. Months where permits were readily available are unconstrained. This measures system pressure, not a count of visitors turned away.
The Timed-Entry policy arrived in an economy already correcting from the 2021 post-COVID surge. Real TRT growth had been decelerating before COVID, from +11% to +9% to +4.8% to +1.5% between 2016 and 2019.2 After peaking in 2021, real TRT declined in every subsequent year, but the rate of decline also changed: -12.6%, -7.4%, -1.5%, -4.6% between 2022 and 2025. By 2024, real TRT had converged back to approximately the level the pre-COVID deceleration trend projected.2 (The 2025 decline should not be dismissed, but communities across Utah and the country reported lower visitation in 2025, likely owing to the strong dollar and political disturbances affecting international travel.)
Real TRT (2019$): actual vs. two trend projections
Real TRT in millions (CPI-U West, Dec 2019 = 1.0). The 2017-2019 trend projects $159M for 2025. Actual real TRT tracked this trend closely through 2024 ($157M actual vs $155M projected) before falling below in 2025 ($150M). The 2024-2025 segment is dashed to reflect uncertainty around 2025 macro conditions (strong dollar, international travel disruptions). Source: Utah State Tax Commission; BLS CPI-U West.
Finding one: The economic shift began before the permit system launched
If Timed-Entry caused the economic shift, its start date should coincide with when the trends changed. When candidate breakpoints are tested in an interrupted time-series model (controlling for COVID, seasonality, inflation, and national trends), mid-2021 consistently fits better than April 2022 as the structural break in Grand County's tourism economy.
When both dates are included in the same regression, the April 2022 Timed-Entry variable loses statistical significance and its coefficient reverses sign, while the model anchors at May 2021 as the significant breakpoint. With p = 0.0000495, there is a 1-in-20,202 chance this result is random noise. The same scan extended through December 2022 returns the same answer: April 2022 is not a statistically significant structural break in Grand County.5
This result does not prove Timed-Entry had no effect. It shows the broader shift likely began earlier than the policy start. By mid-2021, Arches was closing its gate nearly every day;8 the overcrowding narrative had been building for years. Peak-season visits held near 2019 levels while shoulder visits grew sharply, a pattern also visible at neighboring parks.1 The Timed-Entry policy went into effect the following spring, itself a reaction to the overcrowding that had begun after the marketing boom post-2013, and the market has not returned to the 2021 surge.
Finding two: The size of any Timed-Entry correlation depends on which baseline you choose
The Arches permit system arrived in a contracting economy, but that does not mean the policy had no exacerbating effect. Visitation to Arches fell during the four years the policy was active, and some of that decline correlates with the permit system. The question is how much, and the answer depends on what "normal" growth would have looked like if COVID had not interrupted the trend.
A supply-controlled interrupted time series regression (controlling for hotel supply growth, lagged room rates, gas prices, seasonality, and the 2020-2021 COVID disruption) estimates the correlation between the Timed-Entry variable and real TRT. The size of that correlation changes materially depending on which pre-COVID years the model treats as the baseline for expected growth.5
The two baselines represent different worlds. The 2015-2019 baseline asks: what if the Mighty Five boom rate had continued? Under that assumption, real TRT ran roughly $11 million per year below the model's projection. The 2017-2019 baseline asks: what if the plateau had persisted? That gap drops to roughly $6 million per year, and it is no longer statistically significant.
Real TRT revenue post-COVID tracked the 2017-2019 projection through 2024 ($157M actual vs $155M projected), suggesting the deceleration was the norm and the boom-era baseline overstates the counterfactual. This report treats the 2017-2019 baseline as more plausible, but both are presented.
| Assumption | 2015–2019 baseline Boom rate continues |
2017–2019 baseline Plateau persists |
|---|---|---|
| Baseline assumption | Mighty Five growth continues through 2025 | Post-boom deceleration continues |
| Projected real TRT (2025) | ~$184M | ~$159M |
| Actual real TRT (2025) | $150M | $150M |
| Implied gap vs. projection | ~$34M | ~$9M |
| TE-associated share (regression) | ~$11M/yr | ~$6M/yr |
| Statistical significance | Marginal (p ≈ 0.02) | Not significant (p ≈ 0.19) |
| Which baseline fits actual trajectory? | No. 2024 actual ($157M) matched 2017-2019 projection ($155M), not this one | Yes. Actual tracked this projection through 2024 |
Both estimates represent a modeled upper bound on the Timed-Entry-associated share of the gap, not a direct observation of lost revenue. The model needs an effect larger than either estimate to detect it reliably (MDE ≈ 21%). Source: Utah State Tax Commission; BLS CPI-U West.
Three factors push even these estimates above the likely effect:
- The model codes every Timed-Entry month at the same intensity regardless of whether permits actually sold out. When permits were available, it is difficult to argue they restricted visitation. See the seasonal decomposition below.
- The model uses Canyonlands as an implicit benchmark for regional demand. Canyonlands was gaining visitors on its own during this period as the adventure tourism segment expanded, particularly in shoulder months. When a control is growing for its own reasons, the treatment effect on the treated park looks larger than it is.
- Several forces that depressed summer revenue (rising room rates, seasonal preference shifts, and the national post-2021 outdoor recreation correction) operated in the same months and on the same revenue stream as the Timed-Entry variable. The model cannot separate these from the policy effect, and the coefficient likely absorbs some of their impact.
Neither estimate can be treated as precise. The model needs an effect larger than either estimate to detect it reliably, and the boom-baseline result barely crosses the conventional significance threshold while the deceleration-baseline result does not. That difference reflects the baseline choice, not different information about the policy. Full regression output and statistical detail are in the Appendix.5
Finding three: Revenue during more constrained months stayed well above 2019 despite fewer Arches visitors
During the months when the permit system was most constraining (April, May, June, September, October), Grand County's real lodging tax ran 112-126% of 2019, despite Arches visits running below 2019 levels. These months generated more revenue from fewer park visitors, even after adjusting for inflation.12.
This can partially be explained by the increase in hotel demand. Hotels' share of constrained-month lodging tax grew from 62% in 2022 to 68% by 2025, even as 42% more STR listings entered the market.23 Room-nights per Arches visit rose from 0.315 in 2019 to 0.446 in 2025, a 42% increase.12 The visitors who came during the Timed-Entry period generated more hotel nights per park visit than the 2019 mix, and the ones who stopped coming generated fewer. The missing visitors were less likely to be hotel guests, which means their absence cost the lodging tax base less than a per-visitor average would suggest.
At the same time, July and August weakened. Real TRT in summer fell from $26.0M (2022) to $21.0M (2025), despite permits being freely available.2 Restaurant taxable charges in the same months ran 1-5% above 2019 in every Timed-Entry year.2 Visitors were in Grand County in summer, eating in its restaurants, but not generating lodging tax at 2019 rates. With summer carrying less of the county's tax base each year, every marginal dollar of shoulder-season revenue matters more.
The cost of the permit system to county lodging tax is bounded in Finding Four below.
Finding four: TRT declined most in the months when the permit system was not restricting anyone
Revenue tracked constraint level across all four years of the program, in the opposite direction of what critics predicted. Months and years with higher constraint rates had stronger revenue relative to 2019. The correlation is strongest in the months that changed constraint level during the program.25
The percentage of days when permits were near capacity declined in every month, from 61% of days in 2022 to 35% in 2025.5 The 2022 regression coefficient (-30%) is the strongest of any year, consistent with a first-year policy shock that faded as visitors adapted.5
Observing June throughout the program demonstrates this pattern
June is the only month that shifted from near-total constraint to near-zero across the four program years. Revenue tracked this shift across all four years:125
| Year | June constraint rate | June real TRT vs 2019 |
|---|---|---|
| 2022 | 97% | +10.4% |
| 2023 | 100% | +8.5% |
| 2024 | 47% | -15.8% |
| 2025 | 3% | -21.5% |
June's constraint rate and TRT performance correlate at +0.96 across the four program years. April (+0.92) and July (+0.97) show the same directional pattern. Loosening the permit system did not improve revenue outcomes, and was associated with worse ones.52
Estimating the upper bounds of the permit system's cost to county lodging tax
Even assuming 100% of lost visitors in all constrained months were turned away by the permit system and never arrived in Grand County, this translates to $11-14 million per year if each missing visitor generated the same lodging tax as the 2019 average, or $15-22 million at the rates observed during the Timed-Entry period. The regression estimate of $6-11 million falls at the lower end.5
Applying the highest bound of this range ($22 million) would have increased real TRT in 2025 from $149.8 million to $171.8 million, still $25 million short of 2021. Regardless, as both June and October demonstrate, more visitors did not reliably produce more lodging tax.2
June
June is the month whose constraint level changed most dramatically. When permits sold out nearly every day in 2022 and 2023, visitation ran 44,000-53,000 below 2019 but TRT held above 2019. Between 2023 and 2024, the constraint rate fell from 100% to 47%, but visitation did not change: the park let nearly the same number of visitors through (180,782 vs 180,563). However, at the same time, TRT fell $5.1 million.12
Over the four-year period, June contributed $6.7 million of the $22.3 million cumulative real TRT decline (30%), more than July and August combined ($5.0 million, 22%), the majority of which was due to decreasing revenue during periods when permit demand sank. In comparison, the core constrained months (April, May, September, October) contributed $4.1 million towards the drop (18%). The month where permits loosened most drove a larger share of the decline than the months where permits were never constraining.2
July and August 2025
NPS paused the reservation system entirely from July 7 through August 27, 2025, citing low demand: “There's no reason to make visitors jump through hoops if the parking lots aren't actually filling up.” For nearly two months, anyone could enter Arches without a reservation. July visits (158,207) were essentially unchanged from 2022-2024 when permits were active. August visits (150,262) were slightly up. But July real TRT ($10.8M) and August real TRT ($10.2M) were the lowest of any Timed-Entry summer. No permits, no surge, no revenue recovery.102
October 2025
The permit system ended in September 2025. In October, Arches visitation rose 16.6% over the prior year while every peer park in Utah declined (Canyonlands -9.2%, Capitol Reef -7.8%, Bryce Canyon -25.9%). Critics pointed to this as proof that the permit system had been suppressing demand. But real TRT in October 2025 ($18.2M) was lower than October 2024 ($18.8M) and October 2023 ($18.7M) when permits were in place. Despite a large increase in visitation, the county collected $600,000 less in lodging tax, signaling the disconnect between Arches visitation in unconstrained months and visitor spending.12 Instead, this pattern may be best understood in comparison to the wider NPS system, which saw October visitation rise 12% above 2019 across 56 national parks in 2025, part of a system-wide shift toward shoulder-season travel documented by NPS since 2022.1
Hotel operators reported that the first year (2022) brought cancellations and confusion, but guests adapted. By the program's later years, operators described the impact as manageable. The system was most constraining and most costly in 2022, and both the constraint rate and the estimated cost declined each year as visitors and the park service adjusted.10
How the permit system loosened over four years
| 2022 | 2023 | 2024 | 2025 | |
|---|---|---|---|---|
| Apr | 93% | 77% | 62% | 60% |
| May | 97% | 90% | 94% | 61% |
| Jun | 97% | 100% | 47% | 3% |
| Jul | 16% | 23% | 6% | paused* |
| Aug | 0% | 0% | 3% | paused* |
| Sep | 63% | 73% | 72% | 37% |
| Oct | 3 days only | 69% | 61% | ended Sep 30 |
| Avg | 61% | 62% | 49% | 35% |
Percentage of days in each month when permits were at or above 95% of capacity. *NPS paused the reservation system July 7 through August 27, 2025, citing low summer demand: "There's no reason to make visitors jump through hoops if the parking lots aren't actually filling up." Source: NPS permit data; SFGATE, July 2025.
No-show rates rose from 31% to 35% over the course of the program, higher in 2025 than 2022 for every month. The system became less restrictive in aggregate, and more permit-holders chose not to arrive.5
Constrained months show modest deterioration (about 10% over four years, 2022-indexed) relative to the larger decline in July and August (about 19%), which occurred when permits were available. A placebo test confirms the same summer underperformance existed before the permit system (2018-2019).25
When permits were most constraining, revenue was most stable
Average permit constraint vs. real TRT change vs. 2019, by month (2022–2025 average)
Constraint intensity = share of days in the month with ≥95% of permits sold, averaged across 2022–2025. TRT change = average annual real TRT for that calendar month relative to the 2019 baseline. High-constraint months (Apr, May, Jun, Sep, Oct) ran well above 2019 despite fewer Arches visitors; only July and August, the least constrained months, showed revenue weakness. Source: NPS Arches permit data; Utah State Tax Commission.
A regression separating the Timed-Entry variable by month group is consistent with this pattern: core constrained months show no negative association, June is near zero, and the entire negative signal loads onto July and August where permits were not constraining. A placebo test on 2018-2019, before any permit system existed, produces the same summer underperformance. Full regression output is in the Appendix.5
Finding five: Other local and regional data trends point to correlating factors that explain changes in TRT revenue and Arches visitation
Declines in summer visitation reflect across the region and nation
Effect: Explains the decrease in summer demand and increasing visitation in the shoulder and off-seasons
Beginning in 2021 and continuing until today, visitation to Arches National Park began to spike in the shoulder season and off-seasons, particularly in the first three months of the year. In 2021, this was explained by gate closures which led to peak-season visitation sitting barely above 2019 levels, while shoulder months were closer to 30% higher.18
Post-2021, the data do not have a single explanation for this trend. A 2015 study found that national park visitation drops sharply once temperatures exceed 77°F, and projected that warming would extend shoulder seasons by two to four weeks while summer visitation at heat-exposed parks plateaus or declines (Fisichelli et al., 2015). A 2025 study of NPS staff across 31 parks reported that this shift is already underway (Rappaport Keener et al., 2025). Whether and how climate is reshaping visitor timing at Arches specifically is a question for future study, but the pattern is clearly visible across the entire system and several indexes. Changes in visitation throughout the year in the Timed-Entry period are at least partially explained by this broader trend, and cannot be attributed to the reservation system. Visitation is growing in the winter, spring, and fall while peak-season visitation is flatlining or contracting.
2022 Monthly Visitation: Canyonlands NP / indexed to 2019
The summer drop in visitation to Arches did not register at neighboring parks
Effect: Visitors who stopped coming to Arches did not stop coming to Grand County; Canyonlands and Dead Horse Point absorbed the difference
Arches summer visits (June through August) fell 22-24% below 2019 in every year of the program and showed no recovery. Spring was different: April improved from -11.7% in 2022 to -4.0% in 2025. May improved from -20.9% to -11.0%.1
Canyonlands moved in the opposite direction. April visits grew 10-20% above 2019 throughout the period, July also grew, and September and October grew strongly. The divergence between Arches and Canyonlands was widest in July (28-35 percentage points) and September (12-37 percentage points), and narrowest in August, the month where heat suppresses visitation at both parks roughly equally.1
The Trail to Tomorrow Visitor Perception Study (1,345 respondents, 2024) identifies the visitors driving this shift. The "Adventurer" segment comes for specific trails and activities, stays 3.8 days (vs 3.3 for sightseers), and is the most likely to return. The "Overlapper" segment treats Moab as part of a larger travel plan. Both segments are growing. The "Sightseer" segment, which comes primarily for Arches, is the least likely to return. Canyonlands shoulder growth is these visitors showing up.
If the permit system were driving the Arches decline, the decline should be sharpest in the months where permits constrained access and absent in the months where they did not. The opposite is true. And the visitors who stopped coming to Arches in summer did not stop coming to the area. Canyonlands absorbed them, or they were never Arches-dependent in the first place.
Arches summer visits collapsed vs. constrained months
Summer room prices did not adjust to meet demand
Effect: Room rates did not adjust to falling summer demand
During the years Timed-Entry was active, visitation in July and August fell sharply while permits went unsold. Despite this weakness, room rates in these months did not adjust downward to attract demand. Unconstrained summer ADR (July and August) averaged $162 across the four years, lower than the constrained months of spring ($222) and fall ($216), but operators held rates above the level that weakening demand warranted.3
Prices did decline year over year as the market softened, but not enough to arrest the demand decline in unconstrained months. This is consistent with price-sensitive visitors choosing alternatives to hotel lodging, a trend noted by tourism industry leaders in the Trail to Tomorrow process. It may also be consistent with some visitors choosing other destinations altogether.
The Trail to Tomorrow perception survey backs this up from the visitor side. Moab ranked first among 14 outdoor recreation destinations for natural beauty and outdoor experiences, but last for value for the money. Business operators note that competitor destinations like Washington County, UT (home to Zion and Sand Hollow); Fruita, CO; and Bentonville, AR all market themselves to similar visitors at lower price points. Constrained months (spring and fall) commanded the highest room rates, averaging $215-222. Unconstrained summer rates were $40-60/night lower but still did not drop far enough to arrest the decline in demand.3 While room prices overall held firm, the failure to discount in July and August may have suppressed the volume of overnight stays when alternatives were most available to price-sensitive visitors.
UDOT corridor traffic points to a summer plateau
Effect: Relative decreases in pass-through traffic add to summer lulls in visitation and hotel demand; some potential suppressed demand in the shoulder-seasons
UDOT traffic counts on US-191 near the Arches entrance ran 5-8% above 2019 in the constrained months across all four Timed-Entry years. People drove to Moab during permit season. In July and August, traffic was flat to down (as much as -8.5% in 2024), consistent with the summer demand softening visible in park visits and TRT.10
June traffic tracked constraint level. When permits sold out in 2022-2023, traffic ran 2-4% above 2019. When constraint dropped in 2024-2025, traffic dipped to 2.5% below 2019, a modest decline compared to June TRT's 22% drop. Visitors still drove through Moab in June. They spent less on lodging.
October 2025 traffic was 6.5% above 2019, healthy but well below the 16.6% increase in Arches gate counts. The road got somewhat busier; the park got much busier. The additional visitors who entered Arches after permits were removed were already on the corridor.
Timed-Entry shows no statistically significant impact on the region
Effect: The same correction visible in Grand County appears across all neighboring counties, none of which had a permit system
Following 2021, visitation dropped to all parks in the region. To understand whether this is attributable to the policy change at Arches in April 2022, the same interrupted time-series analysis used to analyze the trend change in Grand County was applied to all counties in the region. The results reveal that April 2022 is not a statistically significant inflection point anywhere. ITS coefficients for Kane, San Juan, and Garfield at April 2022 range from −3.5% to −18.5%. P-values run from 0.19 to 0.76. None reaches significance.5 This is supportive regional context, not a fully matched causal comparison. County-specific structural differences (supply levels, visitor composition, anchor parks) remain.
Regional ITS comparison chart and methodology in the appendix →The pre-COVID curve explains why Arches has been slower to correct
One of the more pointed findings in the Hancock Report was that Arches rebounded more slowly than other parks in the region after the 2021 peak. By 2025, Arches sat at 91% of its 2019 level. Canyonlands reached 109%. Capitol Reef hit 113%.1
But Arches is not unique in this. Rocky Mountain National Park, the other major park that ran a timed entry system during this period, shows the same pattern: 89% of 2019 by 2025.1 The two parks with reservation systems were the two slowest to rebound among comparable parks, which is consistent with either the permit system holding visits down or with both parks approaching a physical capacity limit that slowed their growth before COVID arrived.
The broader data leans toward the ceiling explanation, but it is not clean. Of the comparable parks with full 2025 data, four of six are still below 2019: Bryce Canyon (75.8%), Rocky Mountain (89.3%), Arches (91.1%), and Zion (98.0%). Only Canyonlands and Capitol Reef exceeded 2019. The pattern does not sort neatly by pre-COVID growth rate or by whether a park had a reservation system. Bryce Canyon grew faster than Arches before COVID and rebounded less. What most of the lagging parks share is scale and visibility: they are large, well-known destinations that attracted a surge of post-COVID visitors who have since moved on.1
Arches' slower recovery is consistent with a park approaching its physical ceiling. It is also consistent with the broader national correction that hit high-profile parks harder than smaller ones. Both forces are likely at work. The data cannot separate them cleanly, but it does rule out one explanation: that Timed-Entry alone accounts for Arches falling behind. Parks without reservation systems fell behind by the same amount or more.
Business operators point to changes in marketing as the culprit
Business operators interviewed for the Trail to Tomorrow plan did not primarily blame the permit system for the softening economy. They pointed to two other factors: the county's decision to replace tourism promotion with "Recreate Responsibly" messaging, and a growing perception that Grand County is unfriendly to visitors, particularly off-roaders. Competitor destinations, according to the plan, "have been quick to take advantage, touting their offerings as more visitor-friendly than Moab's." The regression cannot separate "deterred by the permit" from "deterred by the price" or "deterred by the vibe." All three operated in the same months on the same visitors.
The analysis in this section can estimate how Timed-Entry aligns with Arches visitation and with a modeled spending gap. It cannot directly observe how many denied or deterred park visitors still spent money elsewhere in Grand County. Hotel demand and restaurant spending remained above 2019 levels throughout the Timed-Entry period, even as park visits fell, which means the gap between lost Arches visits and lost county spending is not one-to-one. Depending on the baseline and the assumptions used to translate park-level effects into spending, the permit system aligns with a minority share of the modeled Arches-related spending gap. That share should be treated as an upper bound, not a precise accounting of lost county revenue.
What the data show directly, what the models infer, and what remains unresolved
| Directly observed | Modeled inference | Unresolved |
|---|---|---|
| Arches visits fell and remained below the pre-COVID trend in every Timed-Entry year (2022–2025) | $6–11M/yr correlation between TE variable and real TRT, depending on which baseline is used | How many deterred Arches visitors spent money elsewhere in Grand County |
| Real TRT stayed above 2019 levels in all four Timed-Entry years | Hotel supply compression explains more of the per-unit revenue decline than park visitation does | Whether the deterrence effect waned, adapted, or shifted visitor behavior over the four years |
| Structural break in TRT fits mid-2021 better than April 2022 (Chow test) | Constrained/unconstrained decomposition: coefficient loads almost entirely on months when permits were available, not constrained | The magnitude of the visitor mix shift toward adventure/camping segments vs. hotel-staying visitors |
| Constrained months (Apr, May, Jun, Sep, Oct) had the most stable revenue of the Timed-Entry period (112-126% of 2019) | Placebo test using 2018–2019 data (no TE) reproduces the same summer-decline pattern, suggesting a seasonal artifact | The residual TE contribution after separating the seasonal artifact and supply-side competition effects |
| The largest revenue declines concentrated in July and August when permits frequently went unsold | ||
| Hotel demand grew while Arches visits fell. Demand and park visits decoupled during the TE period |
Source: NPS IRMA Portal; Utah State Tax Commission; STR Inc./CoStar via Moab Area Travel Council.
What both explanations of the Timed-Entry coefficient agree on
The constrained months where permits limited access to Arches experienced the lowest decline in lodging tax revenue, counteracting the narrative that permit availability drove the decline. The decline primarily came from months where permits sat unsold, but business owners report that the system was easy to navigate once people knew it existed. Visitation also dropped in the off-season when the permit system was not active.
Whether the regression's coefficient contains a meaningful Timed-Entry-specific component or is mostly an artifact of timing remains open. The data leans toward the latter but cannot rule out a partial contribution between 0% and the model's detection limit of roughly 21%. June's trajectory provides the closest thing to a natural experiment: when permits constrained access, June held above 2019; when they loosened, June fell sharply.
Section threeThe transforming Moab tourism market
Operators in Grand County are right that business got harder after 2021. Real revenue per available hotel room fell 23% from its 2021 peak.3 Occupancy in 2023 and 2025 was the lowest in a decade outside of COVID. Margins are thinner than they were in 2019, and thinner than they were in 2017.
Real TRT revenue and Arches visitation was already declining prior to the COVID shock, yet lodging supply continued to grow in all categories: hotels, nightly rentals, and campgrounds. Visitor frustration began well before the gate closures in 2021, changing market perception about Moab. The region's own shift from tourism promotion to "Recreate Responsibly" messaging reinforced that perception, as did the introduction of the permit system at Arches.
Still, most of the TRT decline during the Timed-Entry period concentrated in July and August when permits were freely available. The months where permits actually constrained access had the most stable revenue of the period. If the permit system were the primary cause, that pattern would be reversed.
Timed-Entry is the most visible policy change in the period, which makes it an intuitive explanation. The market data point to a more structural story: a lodging supply cycle was already compressing per-unit revenue before COVID, a pricing correction pushed visitors toward alternatives, and the visitor mix is shifting in ways the county's own strategic plans called for.
A lodging market built for a different economy
From 2013 through 2017, Arches visitation grew 42%1 and hotel supply grew alongside it, with room inventory increasing about 18%3. But when visitation plateaued between 2017 and 2019 (growing just 4.7% over three years), hotel construction already in the pipeline continued delivering rooms, and short-term rental listings began competing for the same guests. By early 2020, the county's own economic development department was warning that occupancy was falling and more supply was on the way.
By 2025, hotel room supply had grown 24% above 20193. Active short-term rental listings grew 42% over the same period, from 752 to 1,068 units4. Hotel demand grew 23%3.
Lodging supply: hotel rooms, STR permitted units, and active STR listings
Monthly data, 2012-2025. Hotel rooms and STR permitted units from Grand County records (interpolated from annual anchors). Active STR listings from Lighthouse/Transparent via Utah Office of Tourism (2019+). Local quarterly STR counts from Grand County Building Official reports (2017-2018). The moratorium held new STR permits roughly flat after 2019; growth in competitive supply came from activating existing permits (59% activation in 2019 rising to 84% in 2025).
During peak season between 2022 and 2025 (April through September), hotel room-nights sold grew 12.3% above 2019, but hotel room-night supply grew 20.2%3. Active STR listings added further competition. Peak months are when room rates are highest and when operators need to earn the revenue that covers year-round fixed costs. During those months, the supply gap was large and growing.
| Metric (peak season, Apr-Sep) | 2019 | TE-era avg (2022-2025) | Change | What it means |
|---|---|---|---|---|
| Room-nights available (supply) | 462,198 | 555,532 | +20.2% | New hotel construction* |
| Room-nights sold (demand) | 365,543 | 410,528 | +12.3% | More guests booked rooms |
| Occupancy rate | 79.1% | 74.0% | −5.2 pp | More rooms per guest than in 2019 |
| Real ADR (Dec 2019 $) | $165.29 | $164.26 | −0.4% | Essentially flat in real terms |
| Real RevPAR (Dec 2019 $) | $130.72 | $121.67 | −6.9% | Occupancy decline lowers per-room revenue |
*Does not include the 42% increase in active short-term rental listings over the same period. Source: STR Inc./CoStar via Moab Area Travel Council.
Why operators felt worse even while tourism stayed large
TE-era average (2022-2025) vs 2019. *Full-year hotel figures do not include 42% growth in active STR listings. Source: STR Inc./CoStar; Lighthouse/Transparent via Utah Office of Tourism.
This is a well-documented pattern in the hotel industry. John B. Corgel at Cornell's School of Hotel Administration found that hotel supply change lags demand in both directions, producing the type of compression visible in Grand County's data. Zheng (2014) confirmed the mechanism empirically: excess supply growth was "one of the main causes of the decrease in RevPAR." A separate study found that increasing short-term rental stock along with hotel room supply "negatively affects occupancy rates but not ADR", precisely the pattern in Grand County between 2022 and 2025. Short-term rental competition compounds the effect. Zervas, Proserpio, and Byers (2017) found that Airbnb entry into leisure markets reduced hotel revenue 8-10%, concentrated in lower-end hotels and during peak demand periods, which describes Grand County's market segment and seasonal exposure exactly.
Overpriced for growth
When costs rose after COVID, operators raised rates. Nominal ADR peaked near $188 in 20233. At $200-600 per night in peak season, Moab priced itself in the same bracket as Jackson Hole and Sedona. The Trail to Tomorrow visitor survey found that Moab ranked first among 14 outdoor recreation destinations for natural beauty and outdoor experiences, but last for value for the money. A Kem Gardner analysis of CoStar data found that Grand County's rate increases "far exceeded other Utah counties, where profits and rates increased by 50% or less."
Sharon Kienzle, retail sales manager at the Moab Information Center, described what she sees at the counter: “I’ll tell you that’s what people come in and ask for now: camping, because hotel rates in the summer are anywhere from $200 to $600 a night.”
Price-sensitive visitors now have alternatives that did not exist at this scale a decade ago. Washington County (St. George, Hurricane, Sand Hollow) markets itself under the Greater Zion brand at 60-70% below Moab's rates. Fruita, Colorado, three hours from the Front Range, is doubling its trail system and explicitly markets to mountain bikers as a cheaper alternative. Bentonville, Arkansas, has built 500+ miles of trails and doubled its event-driven economic impact to $41 million in 2024. None of these compete for the Arches sightseer. All of them compete for the returning adventure visitor that Grand County's own strategic plan identifies as the future.
What happened in Moab happened elsewhere
Sedona, Arizona: ADR rose 40% to roughly $350/night by 2022, STR supply tripled, and occupancy fell. The city adopted a Sustainable Tourism Plan, launched a free shuttle carrying over 1 million rides, and stopped marketing the destination entirely. By 2025, officials described summer as "very slow," with international visitors down 20%. Sedona has no timed-entry system.
Whitefish, Montana: STR supply grew 57% between 2019 and 2022. Hotel occupancy peaked in 2021 and fell back. By 2025, Canadian travel was down 23%. Residents surveyed in 2025 reported 65% opposition to STRs and 88% concern about housing. Whitefish has no reservation system either. Prices went up, STR competition flooded the market, and visitors started going elsewhere.
Visitation changed but did not disappear
UDOT traffic on US-191 near Moab averaged 109% of 2019 during the Timed-Entry period10. People were driving into the corridor above pre-pandemic rates even as Arches gate counts fell 19%. Canyonlands visits grew 9-12% above 2019. Dead Horse Point grew 9-10%1. Combined visitation to Canyonlands and Dead Horse Point offset much of the Arches decline.
Some of those visitors chose camping, RV sites, and dispersed public land over hotels. No reliable data captures camping or dispersed recreation spending in Grand County, so the size of the shift remains unquantified. But the pattern is consistent with what operators and the Information Center report: visitors are still arriving, but they are making different choices about where to sleep and how much to spend. Those choices move economic activity out of lodging tax receipts and into categories the tax data does not capture.
The restaurant data offers a test. Real food service taxable sales averaged 22% above 2019 across 2022-2024 (three complete years)2, despite a 19% decline in peak-season Arches visits. People who camp still eat. People who day-trip still eat. The fact that restaurant revenue held up while lodging revenue compressed is a lodging-specific story, not a tourism collapse.
Sources: UDOT AADT2024 Unrounded, station 019-0086, MP 129.9. Utah State Tax Commission, quarterly taxable sales by sector. NPS IRMA Portal; Utah State Parks.
What the operators say
Business owners in Grand County are divided on Timed-Entry, but most acknowledge forces larger than the permit system. When the Moab Times-Independent gathered business reactions in November 2023, the picture was mixed.
Shayne Wittwer, part owner of the Sleep Inn and MainStay Suites, was direct: “I can tell you it is stemming from Arches National Park. There is no way around it.” Brian Hunnings at Red Cliffs Lodge said they had counted over 2,000 canceled bookings in the first year of Timed-Entry, then “honestly just got frustrated and stopped counting.”
But other operators saw the problem differently. Jason Taylor, whose tours were down 10-20%, said: “I do not think timed entry was the silver bullet to fix this.” Even trips that had nothing to do with Arches were down. Christy Mello at Expedition Lodge said she “hated timed entry” but added: “I just don’t fully understand why everything is always blamed on the Arches. There's a lot of other factors -- hotel prices, travel costs -- that affect whether people come.”
When the NPS announced the 2026 hiatus, multiple operators described a system that worked better than expected. Venjamin Hopkins at the Aarchway Inn said timed entry “initially brought cancellations and confusion in 2022, but its impact lessened as guests became familiar.” Jarrod Davis at SpringHill Suites said “the first year brought confusion and a slight dip in travel, but guests eventually adapted.” Tom McKay of Moab Express Tours said it brought “predictability to peak-season operations.” Kai Palmer of Desert Highlights called it “a win for everybody.”
The debate over Timed-Entry consumed four years of community attention while the supply cycle, the pricing correction, and the visitor preference shift continued underneath.
Taken together, the data most strongly support a lodging-supply and pricing compression story. They also support a pre-existing decoupling between Arches gate counts and county spending that was visible by 2017. They are consistent with a mix shift in visitor behavior, from peak-season sightseers toward shoulder-season adventure visitors who spend differently. And they cannot cleanly quantify the residual contribution of Timed-Entry within that broader transition. The permit system may have added pressure at the margins. It did not create the structural conditions that explain most of the pain.
ConclusionsWhere we go from here
Grand County spent years asking for a more diversified economy, a broader visitor base, longer shoulder seasons, and less dependence on a single park entrance. In 2024, the Trail to Tomorrow strategic plan found that 77% of visitors came to see Arches, but park-focused sightseers were the least likely to return. Mountain bikers, climbers, and off-roaders reported 75%+ intent to come back within three years. The plan identified three visitor segments: Sightseers (average stay 3.3 days, lowest return intent), Adventurers (3.8 days, highest return intent), and Overlappers who did both. The plan's three pathways prioritize housing, tourism-adjacent businesses, and managing visitor flows. That direction moves economic activity away from peak-season hotel lodging and toward year-round, distributed spending.
Economic diversification has been part of Grand County's public conversation for more than a decade. The 2020 Diversification Action Plan warned that "an economy specialized in one industry is more vulnerable to shock than an economy diversified across several." The county's economic development department was warning that occupancy was declining and more lodging supply was in the pipeline. This was before COVID, before the 2021 surge, and before the Timed-Entry debate.
The sector data points to signs that the shift may already be happening.
| Sector | 2019 base | Real change | Notes |
|---|---|---|---|
| Accommodation | $132M | +23% | More rooms, lower per-unit yield |
| Food services | $57M | +22% | Price-driven; volume growth slower |
| Arts, entertainment, recreation | $14M | +48% | Guides, outfitters, recreation |
| Miscellaneous retail | $14M | +46% | Gift shops, specialty stores |
| Construction | $3M | +83% | Includes hotel and residential |
| Professional/technical services | $3M | +67% | Small base, rapid growth |
| Motor vehicle dealers | $20M | +2% | Essentially flat |
Source: Utah State Tax Commission, quarterly taxable sales by sector. Timed-Entry-era average (2022-2024, complete years) vs 2019. Deflated to 2019 dollars using CPI-U West. Two sectors excluded: gasoline stations dropped 67% and food/beverage stores rose 204% in reported taxable sales, swings too large to reflect real economic activity. These are likely NAICS code reclassifications between the old (447/448) and new (457/458) retail categories.
Arts, entertainment, and recreation grew 48% in real terms while Arches visits fell. Guide services, outfitters, and recreation operators who take visitors rafting on the Colorado, riding Slickrock, or hiking outside the parks are not anchored to a single park entrance. Professional and technical services grew 67% off a small base. Several of these sectors, particularly professional services and construction, align with the diversification goals the county's own economic development plans have called for since at least 2020. Construction grew 83%. The economy is showing some signs of change, but not fallout.
Changes in resident sentiment are visible as well
The Kem Gardner Policy Institute uncovered an interesting shift in their most recent longitudinal report on tourism sentiment: a shift in employment away from tourism.
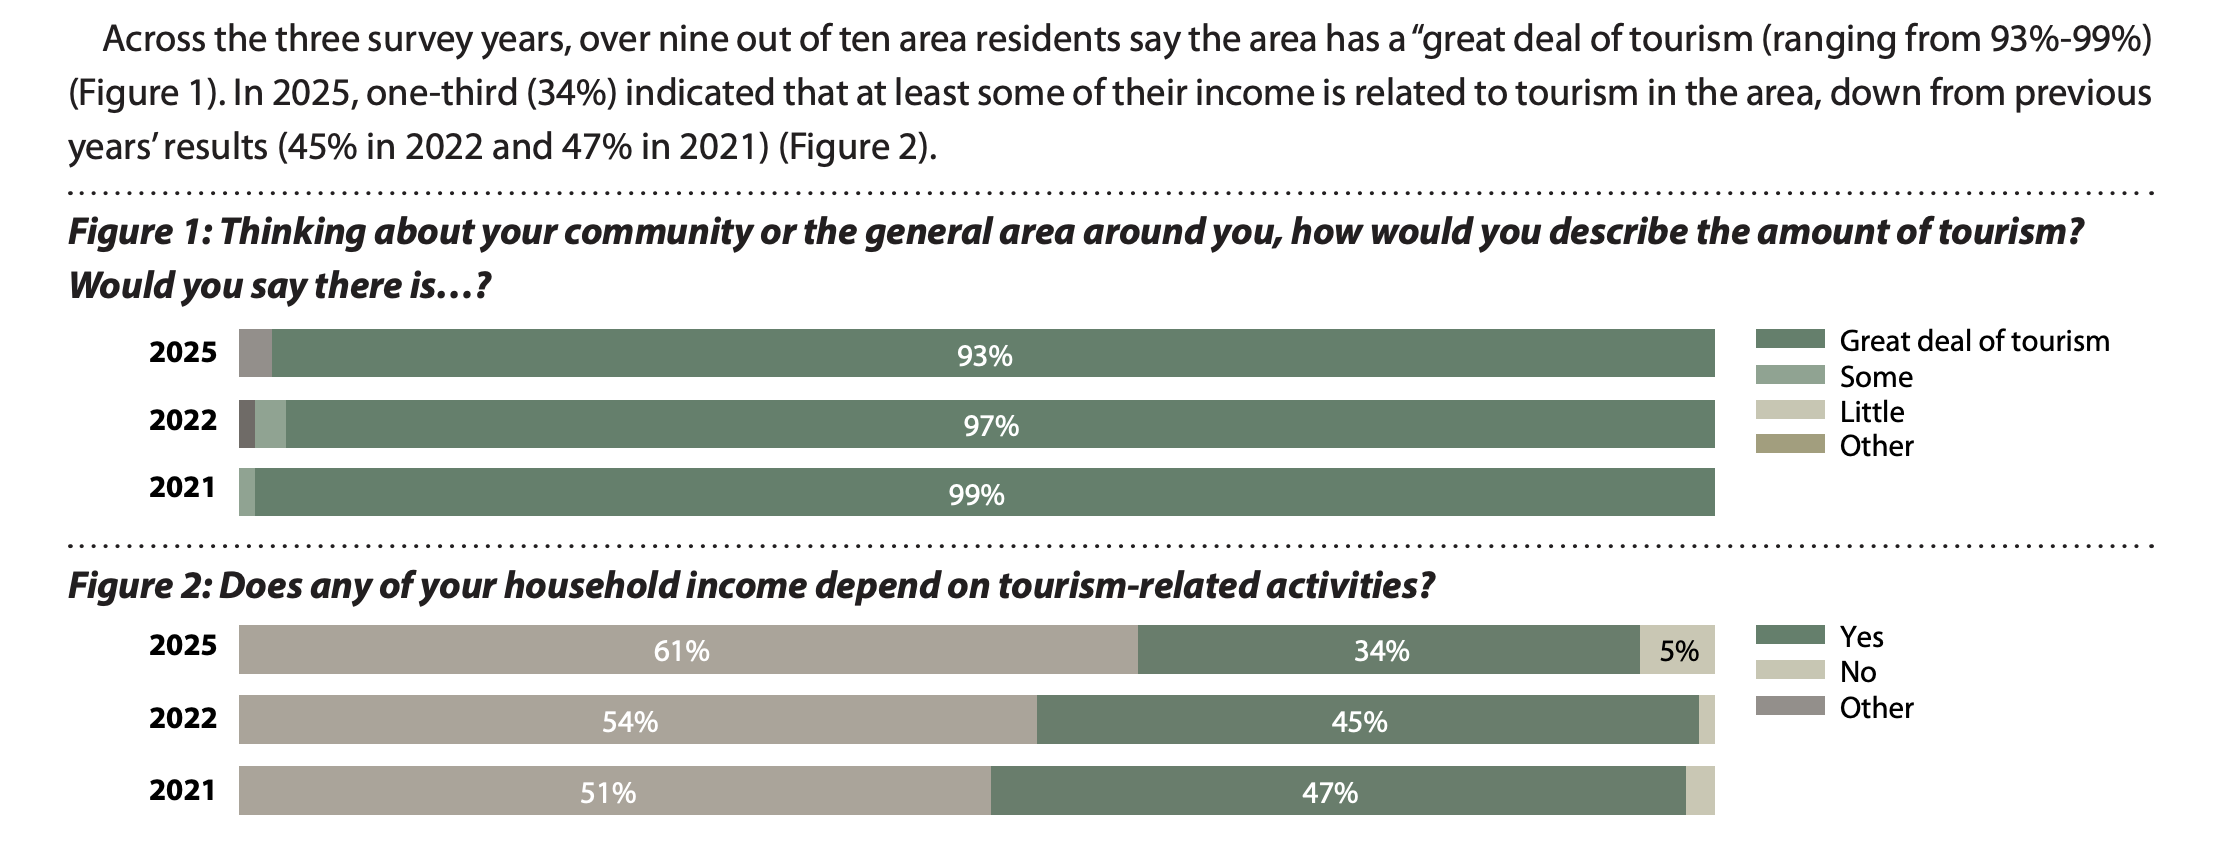
Kem C. Gardner Policy Institute, Moab Local Area Results 2021–2025. Figure 1 (top): 93-99% of residents describe their area as having a great deal of tourism across all three survey years. Figure 2 (bottom): The share of households with any income tied to tourism-related activities declined from 47% in 2021 to 34% in 2025.
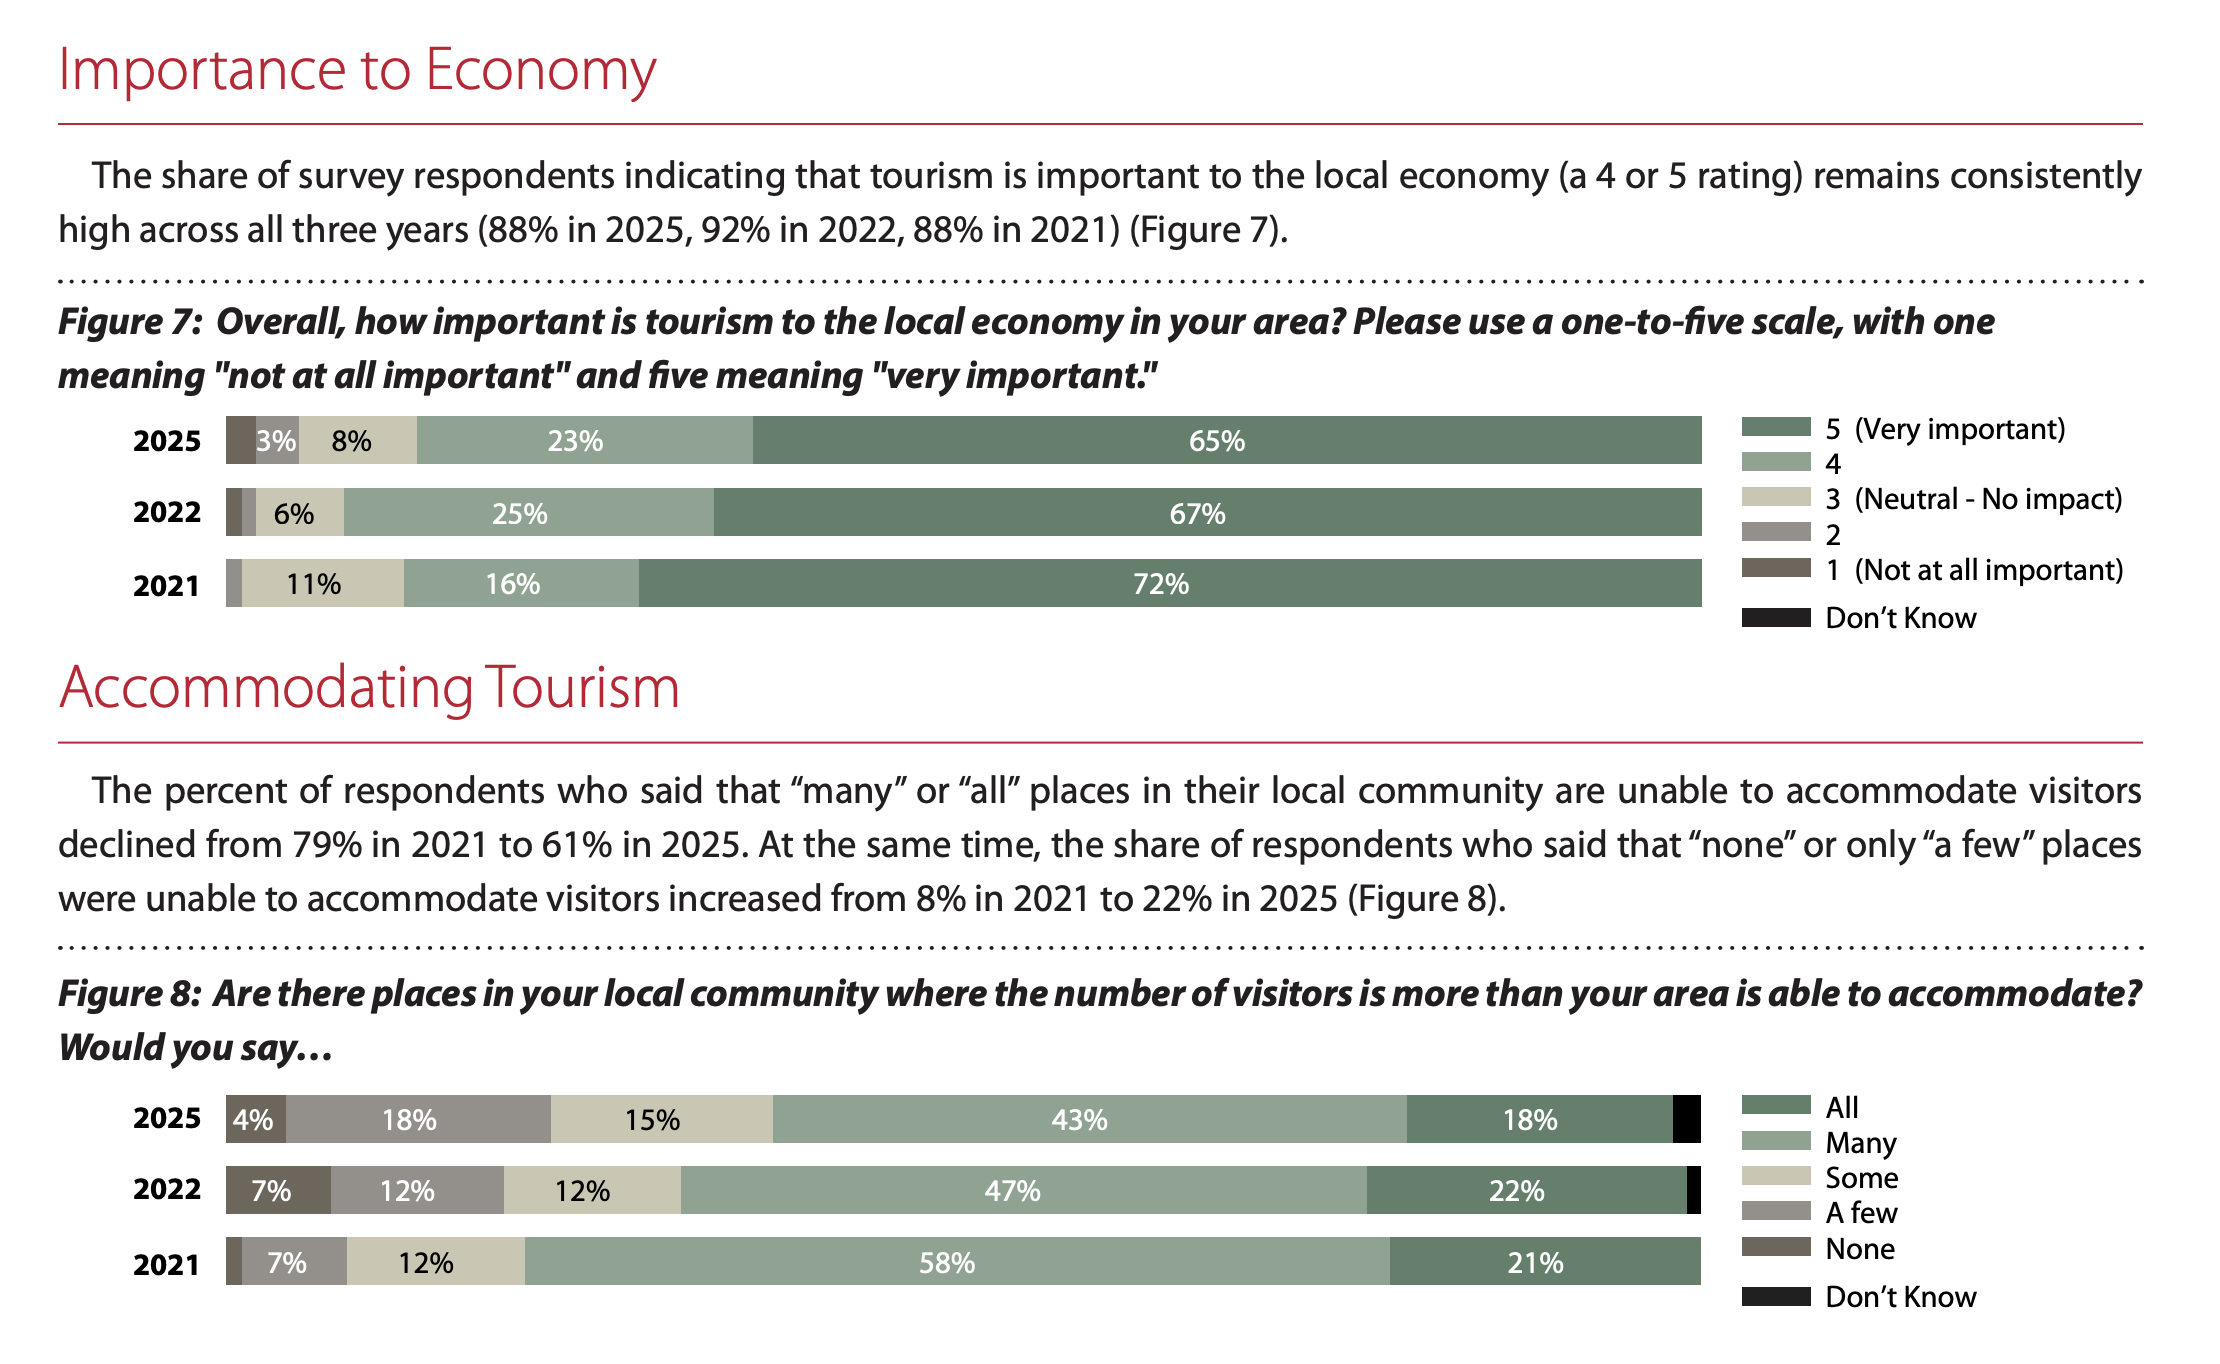
Kem C. Gardner Policy Institute, Moab Local Area Results 2021–2025. Figure 7 (top): 88-92% of residents rate tourism as important to the local economy (4 or 5 on a 5-point scale). Figure 8 (bottom): The share saying many or all places in the community are unable to accommodate visitors declined from 79% in 2021 to 61% in 2025, suggesting perceived overcrowding has eased as visitation moderated.
Tourism dominates life and business in Grand County, but fewer households depend on it for income. That 13-point drop (47% to 34%) between 2021 and 202511 could reflect slow, but emerging diversification: households finding income in construction, professional services, and recreation-adjacent businesses that grew faster than traditional lodging. It could also reflect displacement: tourism jobs becoming less stable, pushing workers to find other income. The sector growth data is consistent with the first explanation. Real taxable sales grew across every major category.
Regardless, as the resident base of Grand County continues to evolve alongside local and regional changes, it forces policy questions that have been avoided previously, including which sector to bias towards with public investment and which businesses represent the future of Grand County.
Change is painful
Diversification does not arrive evenly. The operators who invested in business models built for peak-season, Arches-driven demand are absorbing costs that others do not have to carry.
The pool of visitors is changing. Non-park related activities are growing, and these visitors are willing to stay longer, are more likely to camp or stay in non-traditional lodging. Their spending shows up in guides, gear, and restaurants, but perhaps not in room-nights. This is the visitor profile the Trail to Tomorrow plan targets as the future of Grand County tourism.
At the same time, the growth in non-tourism sectors creates pressure of its own. As professional services, construction, and remote work bring non-tourism incomes into the county, those earners compete with hospitality workers for housing. Arches received 500 job applications for seasonal positions in 2026, but filled only 5 of 15 openings. Sharon Kienzle explained why: “Everyone is telling them that they took a job somewhere else or there's no housing available.” Housing shortages drive up wages, further compressing operator margins and making it harder to lower room rates, which push more visitors toward camping and cheaper destinations. A vicious cycle.
Grand County is not alone. Tourism dropped statewide in 2025, and operators in other gateway towns report the same pattern: "Each year, you've got to make 2% or 3% more money just to keep up with inflation." The marginal loss of Arches visitors from Timed-Entry may have added to this pressure in Grand County. It does not explain the statewide pattern, and removing it does not break the cycle.
These structural forces will shape the next four years regardless of whether the permit system returns.
Is it worth investing in Arches capacity?
There is growing demand to increase the number of visitors who can enter Arches National Park at any time, but it is unclear to extent to which this would drive underlying growth in the local economy.
The park's parking inventory totals roughly 660 to 800 spaces across all lots12. At 2.5 people per car and a 3.3-hour average visit against a 12-hour operating day, throughput maxes out near 6,000 visitors per day. The 2019 peak-season average was about 6,4001. In 2021, daily demand pushed above 9,900 on peak days1, and the park closed its gates 118 times8.
Expanding parking is the most direct intervention. It could allow Arches to absorb 15-40% more visitors per day depending on the design. But even at full build-out, the additional visitors would need to book hotel rooms to move the RevPAR needle. The data from the Timed-Entry period suggests the marginal visitor who would arrive without a permit constraint is more likely to camp than to book a $300 room.
A shuttle system would improve the visitor experience and ease congestion. Sedona's shuttle has carried over 1 million rides since 2022. But a shuttle changes how visitors move through the park, not whether they book a hotel room when they get to town. Freeing 200 parking spaces does not fill 2,000 additional hotel room-nights per week. The largest decreases in TRT occurred in months when permits were not constraining anyone. A shuttle would not change that.
There is a signal in the shoulder-season data: during the months when Timed-Entry was limiting access, demand for permits exceeded supply. Alleviating the park constraint on those days could draw more visitors to town, if that surplus demand was not already absorbed by visits at other times or to other destinations. Public investment in a shuttle should be evaluated against the real returns it is likely to generate.
A second entrance, if built north of town, raises a different concern. Visitors entering from the north could bypass Moab's commercial corridor, camp on dispersed public lands, or base out of Green River, which is cheaper and closer to I-70. Given that high costs in Moab are already leading visitors to swap out of hotels into other lodging types or regions, making it easier to visit Arches without passing through town could reduce Moab's share of visitor spending rather than increase it.
None of these are reasons not to improve park infrastructure. They are reasons to be clear about what infrastructure investment can and cannot solve. The access problem at Arches and the economic problem of declining real tourism revenues come from different sources.
What local choices could have made a difference?
Some of what happened between 2019 and 2025 was not controllable locally. COVID, the national post-pandemic travel surge, the subsequent normalization of outdoor recreation demand: these were forces operating well above the county level. But the depth and duration of the correction is a supply story, and supply decisions were made locally.
Treat the anchor as a liability as well as an asset. Arches drives foot traffic to the whole corridor. But a single physical draw with a hard capacity ceiling creates exposure: when the draw stalls, everything around it feels it. Communities that have built economic floors independent of their primary federal land asset absorb those shocks differently. Moab has the geography for river trips, mountain biking, arts and culture, dark sky tourism, and agritourism. The investment in diversification lagged the investment in lodging supply. Based on visitor data shared in the Trail to Tomorrow report, this is changing, but on a lag to the pain the lodging industry is already feeling.
Calibrate supply to the anchor's physical throughput, not to trend extrapolation. By 2019, parking saturation and gate closure frequency pointed to a ceiling somewhere around 1.2 million peak-season visits per year1. Supply decisions made above that ceiling were building toward a number the park could not reliably deliver. Research in other leisure markets shows that growth in short-term rental inventory places downward pressure on hotel revenue, and Grand County's 42% increase in active STR listings during this period is consistent with that pattern.
Implement capacity management before the surge, not after. The NPS had been discussing structured visitor management at Arches since at least 2017. A system that launched before the COVID wave would have given supply investors a known, stable ceiling to build against. The chaotic 2021 gate closures, 118 days with no advance notice8, were harder on visitor experience and local businesses than a structured permit system would have been.
The closest comparable community to have navigated this well is Springdale, Utah. Zion implemented a mandatory shuttle in 2000. Local businesses opposed it initially. Visitor satisfaction improved, per-visitor spending increased, and Springdale's lodging market has remained healthy even as canyon visitation plateaued. The community accepted the physical ceiling early and adapted to serve a managed but high-quality visitor stream.
However, Springdale and Zion are an imperfect comparison. The Zion shuttle covers a single popular route through the park but does not restrict overall park access. If Arches had two entrances, perhaps a mandatory shuttle to spur destinations like Delicate Arch could be combined with vehicular travel elsewhere, without a significant infrastructure overhaul. These nuances in comparison should be considered by anyone promoting alternative programs to enlarge capacity. Impacts to regional visitation from a northern entrance should also be addressed by local policymakers.
The economy Grand County actually has
The Timed-Entry debate consumed four years of community attention. During those four years, the economy was changing whether anyone noticed or not. The county’s own planning documents called for diversification. The visitor mix and the sector data both shifted, and fewer households depend on tourism for income than did in 2021.
The pain that lodging operators and the businesses connected to them express is backed up in the data. RevPAR and occupancy are both down3, and margins are thinner than they were in 2019. The competitive landscape has gotten harder, with cheaper destinations actively marketing to the adventure visitors Moab used to have to itself.
But the solution will not look like it would have ten years ago. The economy that exists today is not the economy of 2015, when Arches was still growing and every new hotel room filled as fast as it opened. If the main pressure is structural rather than policy-specific, the policy agenda must change as well.
The questions that are actually open
The supply correction. Hotel room inventory grew 24% above 2019 while demand grew 23%, but hundreds of new short-term rentals have also entered the market. How does the County handle future requests to construct more nightly rentals, and to what extent should local policy be driven by the unit economics of hotel operators?
The tax base shift. Visitors are swapping hotels for camping and RVs, putting downward pressure on lodging-tax revenues. If the visitor the Trail to Tomorrow plan targets generates less TRT per visit than the visitor being replaced, what fills the gap?
The housing cycle. As professional services, construction, and remote work bring non-tourism incomes into the county, those earners compete with hospitality workers for housing. That drives up wages, which compresses operator margins, which keeps room rates high, which pushes more visitors toward camping and cheaper destinations. What breaks the cycle?
What visitor is Moab marketing to? The Trail to Tomorrow plan found that 77% of visitors came primarily for Arches, but that segment had the shortest stays and the lowest intent to return. The adventure segment stayed longer, returned more often, and spent across more categories. If the county's own strategic plan targets the second group, the revenue mix will look different than it did when the first group dominated. That is a policy choice with TRT implications.
This report narrows what Timed-Entry can plausibly explain. It does not settle every policy question. The county still has to decide what tourism market it wants and what revenue model can sustain it. Removing the permit system addresses a fraction of the gap. The rest requires decisions that were always the county's to make.